Context
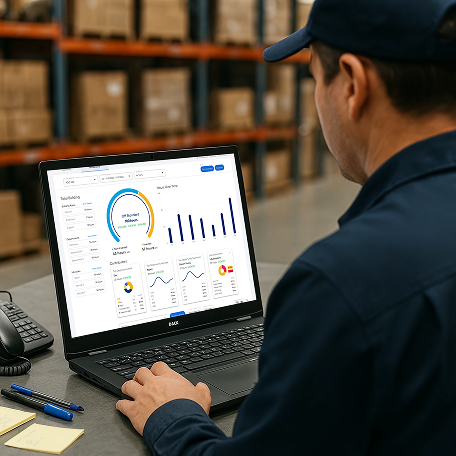
DC supervisors could see that something was wrong. They couldn't see why.
The Supply Chain Scorecard answered one question well: how are we performing? For leadership review, that's enough. For DC supervisors managing shifts, departments, and individual employees across complex distribution environments, it was the wrong question entirely. They needed to move through data — from building to department to the exact driver causing the problem. The existing system had no model for that.
System Failure
The tool wasn't broken. It was solving the wrong cognitive task.
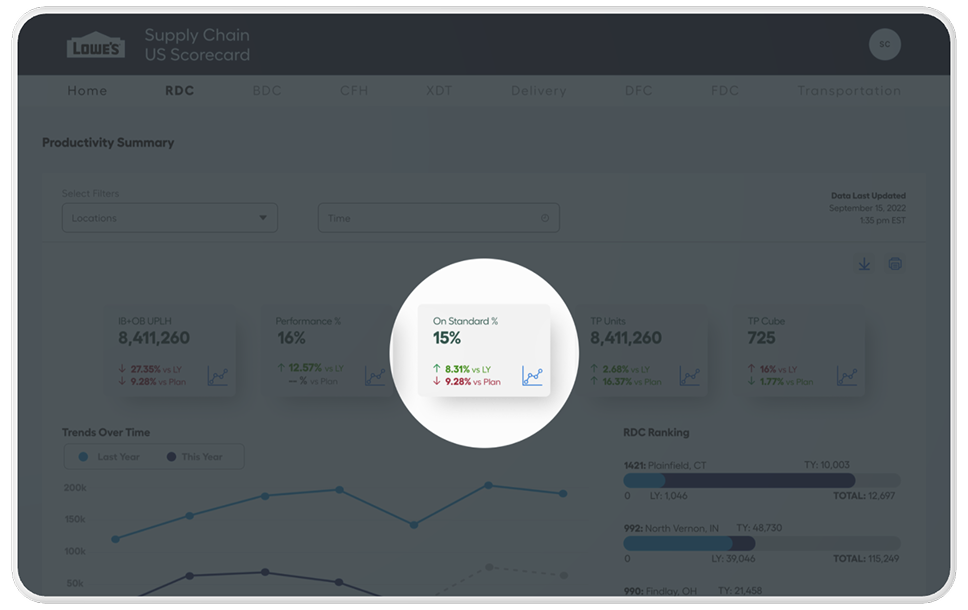
Monitoring and diagnosis look like the same problem. They aren't. Monitoring tells you something is off. Diagnosis tells you where to look. The Summary template — KPI cards, a trend line, a data table — was built for one. Before designing anything, I mapped the decisions supervisors were actually trying to make. That mapping revealed the current system had no model for investigation at all.
The Reframe
Product asked for a new report. I reframed the request as an information architecture problem.
What supervisors needed wasn't a new page, it was a navigational logic that followed how an investigation actually works: start broad, move to specifics, ask different questions at each level. I reframed the request from "build a report" to "design the information architecture that makes this class of problem solvable." That reframe changed the scope of everything downstream.
Process & Key Decisions
The ideal solution couldn't be built. That constraint made the thinking more rigorous.
The right solution was a graph view: a visualization that could represent multi-dimensional data and let users navigate across relationships fluidly. Competitive analysis confirmed it. Engineering couldn't build it.
Most teams retreat here. We went deeper.
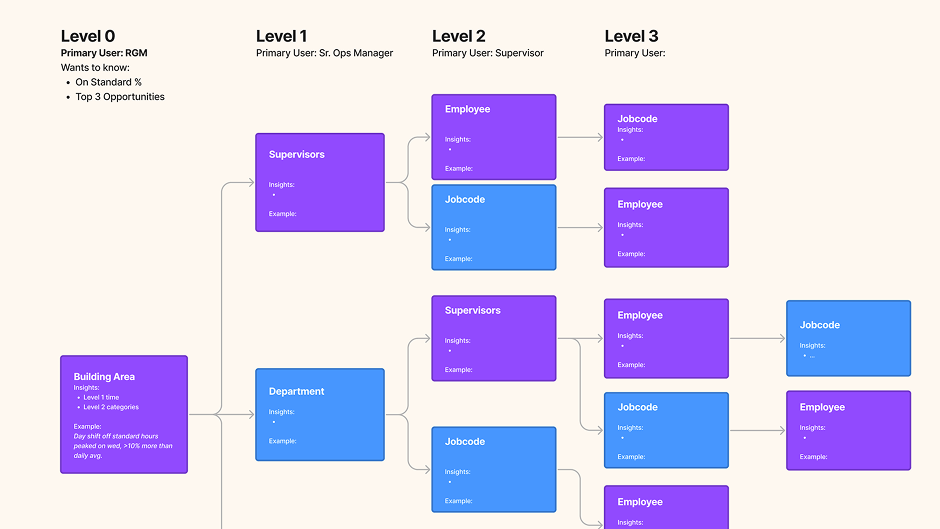
If the graph wasn't executable, the underlying decision model still had to be correct. I mapped every variable: what dimensions supervisors pivot across, what questions each level answers, what information matters at Level 2 versus Level 4. That mapping produced a five-level hierarchy — building area, department, category, driver, insight — where each level had a primary user and a primary question.
The navigation came directly from that structure. Each node wasn't a menu item someone designed. It was a question a supervisor needed to ask, encoded as architecture.
Outcomes & Impact
One template request became the structural model for how the org does diagnostic reporting.
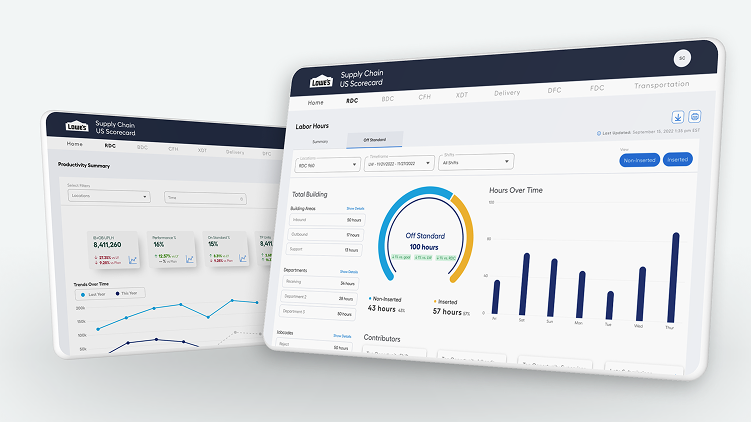
Two template types. Clear names product and engineering could actually use: Summary (how are we performing?) and Insights (why is this happening and where?).
Engineering built the first Insights page from the template. The second took half the time. The pattern extended beyond supply chain and other domains started using it.
75% reduction in design time. 50% reduction in engineering effort. 135% NPS improvement. 120K DC supervisor hours saved annually. ~$2M in annual savings across 20+ pages built on the template.
Reflection
The constraint didn't limit the solution. It improved it.
The graph view would have been more expressive. However, the hierarchical drill-down was more executable and the constraint forced a more precise mapping of the decision tree. This created a more structurally rigorous concept.